
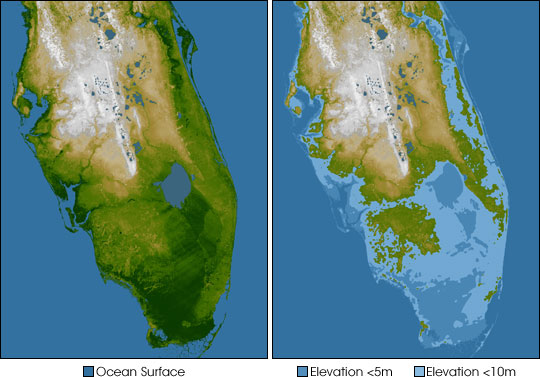
Low-lying parts of Florida.
Although this map shows areas that are above the expected levels of sea level rise over the next century, the areas shown on the map to the right show areas that may be affected by storm surge. Hurricane Katrina was associated with storm surges greater than 20 feet above sea level on parts of the Mississippi coast. With higher sea level, the area of inundation during storms increases further inland.
Source: Image Courtesy SRTM Team NASA/JPL/NIMA.
Questions for discussion
|
Take away concepts
|