
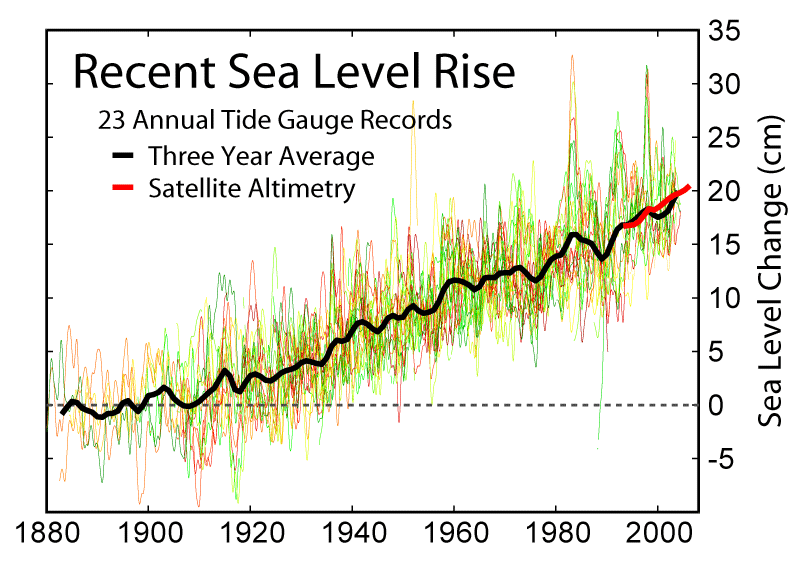
Sea level rise since 1880.
Source of graph: Wikipedia - Image created by Robert A. Rohde / Global Warming Art,
based on data from Permanent Service for Mean Sea Level (PSMSL), Douglas (1997).
based on data from Permanent Service for Mean Sea Level (PSMSL), Douglas (1997).
Questions for discussion
|
Take away concepts
|