For students and teachers
Interactive animations that explain key concepts and processes, plus other interactives and diagrams of related topics for K-12 teachers and students.
Please note that content and links are provided for convenience only. While we do our best to check the quality of our content, we cannot guarantee that it is always correct. We try our best to correct errors as soon as they are brought to our attention so please let us know if you find an error. Hyperlinks that Earthguide provides to external websites do not imply official Earthguide endorsement of, or responsibility for, the content contained on those sites. Links are provided as a service to the user, and Earthguide does not retain editorial control over them. No endorsement of a product or a point-of-view should be inferred.
Please note that content and links are provided for convenience only. While we do our best to check the quality of our content, we cannot guarantee that it is always correct. We try our best to correct errors as soon as they are brought to our attention so please let us know if you find an error. Hyperlinks that Earthguide provides to external websites do not imply official Earthguide endorsement of, or responsibility for, the content contained on those sites. Links are provided as a service to the user, and Earthguide does not retain editorial control over them. No endorsement of a product or a point-of-view should be inferred.
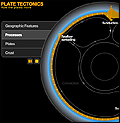
Plate tectonics


Multidimensional activities
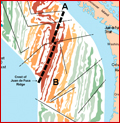

Image credits
Left-to-right and top-to-bottom:
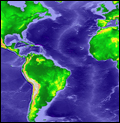
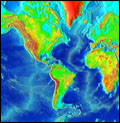
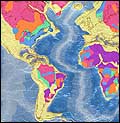
- Surface relief of the Earth #1: Image from computerized digital images and associated databases available from the National Geophysical Data Center, National Oceanic and Atmospheric Administration, U.S. Department of Commerce, http://www.ngdc.noaa.gov/.
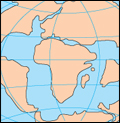
- Past continental positions: Image from This Dynamic Earth by Kious and Tilling, courtesy of the U.S. Geological Survey.
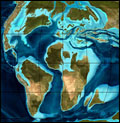
- Past geography: Image ©Ron Blakey, Northern Arizona University.
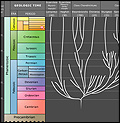
- Geologic time chart: Image from interactive diagram by Earthguide at Scripps Institution of Oceanography.
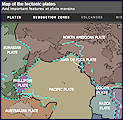
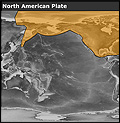
- Modern configuration of tectonic plates: Image courtesy of the U.S. Geological Survey.
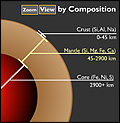
- Layers of the Earth: Image from interactive diagram by Earthguide at Scripps Institution of Oceanography.
- Thickness of the Earth's crust: Image courtesy of the U.S. Geological Survey. Source data are described in W.D. Mooney, G. Laske and G. Masters, 1998. CRUST 5.1: A global crustal model at 57°x5°. J. Geophys. Res., 103, 727-747.
- Surface relief of the Earth #2: Image from computerized digital images and associated databases available from the National Geophysical Data Center, National Oceanic and Atmospheric Administration, U.S. Department of Commerce, http://www.ngdc.noaa.gov/.
- Sonar methods: Image from interactive diagram by Earthguide at Scripps Institution of Oceanography.
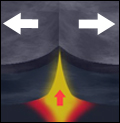
- Seafloor spreading: Image from interactive diagram by Earthguide at Scripps Institution of Oceanography.
- First map of the Mid-Atlantic ridge: From "World Ocean Floor Panorama", Authors Marie Tharp and Bruce C. Heezen, 1977. Copyright by Marie Tharp 1977/2003. Reproduced by permission of Marie Tharp Maps, LLC , 8 Edward Street, Sparkill, New York 10976.
- Subduction: Image from interactive diagram by Earthguide at Scripps Institution of Oceanography.
- Boiling water: Image from video courtesy Eugenia Etkina, Rutgers University.
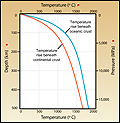
- Temperature inside the Earth: Image from interactive diagram by Earthguide at Scripps Institution of Oceanography.
- Benioff-Wadati zone: TBA.
- Plate margins: Image from interactive diagram by Earthguide at Scripps Institution of Oceanography. Nodified from original computerized digital images and associated databases available from the National Geophysical Data Center, National Oceanic and Atmospheric Administration, U.S. Department of Commerce, http://www.ngdc.noaa.gov/.
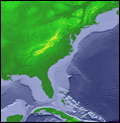
- Continental margins: Data from GLOBE Elevations with bathymetry from Smith and Sandwell. Image from computerized digital images and associated databases available from the National Geophysical Data Center, National Oceanic and Atmospheric Administration,
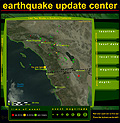
U.S. Department of Commerce, http://www.ngdc.noaa.gov/. - Recent earthquakes in southern California: Image from interactive diagram by Earthguide at Scripps Institution of Oceanography. Data from the Broadband Seismic Data Collection Center at Scripps Institution of Oceanography.
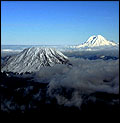
- Volcanic mountains: Aerial view of Mount St. Helens and Mount Rainier: Image taken on December 11, 2004, by John Pallister, image courtesy of the U.S. Geological Survey..
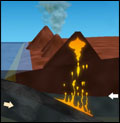
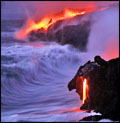
- Volcanic activity: Image courtesy Hawaiian Volcano Observatory of the U.S. Geological Survey.
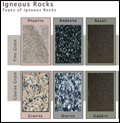
- Igneous rocks: Image from an interactive diagram by Earthguide at Scripps Institution of Oceanography.
- Supercontinents and the Wilson Cycle: Image from an interactive diagram by Earthguide at Scripps Institution of Oceanography.
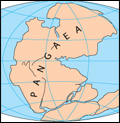
- Pangaea configuration of continents: Image from This Dynamic Earth by Kious and Tilling, courtesy of the U.S. Geological Survey.
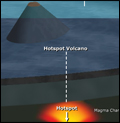
- Hawaiian-Emperor Seamount Chain: Image from an interactive diagram by Earthguide at Scripps Institution of Oceanography.
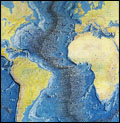
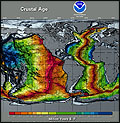
- Age of the seafloor: Image from computerized digital images and associated databases available from the National Geophysical Data Center, National Oceanic and Atmospheric Administration, U.S. Department of Commerce, http://www.ngdc.noaa.gov/. More information available at NGDC.
- Seafloor paleomagnetic anomalies: Image from an interactive diagram by Earthguide at Scripps Institution of Oceanography.
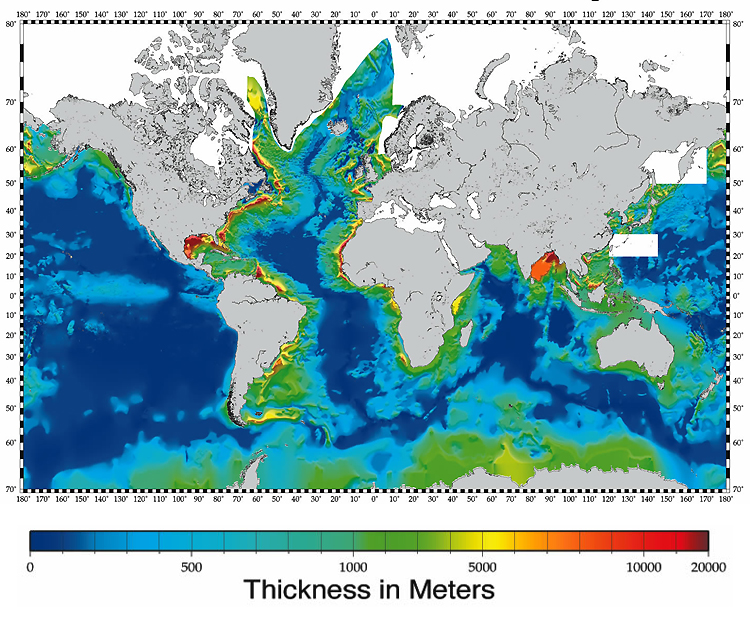
- Seafloor sediment thickness: Image from computerized digital images and associated databases available from the National Geophysical Data Center, National Oceanic and Atmospheric Administration, U.S. Department of Commerce, http://www.ngdc.noaa.gov/. Data described in Divins, D.L., NGDC Total Sediment Thickness of the World's Oceans & Marginal Seas.
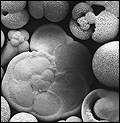
- Shells of foraminifera in marine sediments: Photographer Memorie Yasuda.
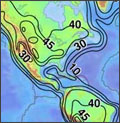
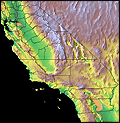
- Surface relief of California: Image from computerized digital images and associated databases available from the National Geophysical Data Center, National Oceanic and Atmospheric Administration, U.S. Department of Commerce, http://www.ngdc.noaa.gov/. Data from Global Land One-Kilometer Base Elevation (GLOBE) 30 arc-second digital elevation model (DEM).
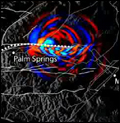
- Earthquake simulation near Palm Springs: Image from Terashake Visualization at the San Diego Supercomputer Center. Visualization by Amit Chourasia, Steve Cutchin - Visualization Services, SDSC. Simulations from SCEC and SDSC.
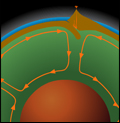
- Earth's internal convection: Image from an interactive diagram by Earthguide at Scripps Institution of Oceanography.
- Paleomagnetic anomalies near the Cascadia subduction zone: Image from This Dynamic Earth by Kious and Tilling, courtesy of the U.S. Geological Survey.
- Locating an earthquake epicenter: Image from an interactive diagram by Earthguide at Scripps Institution of Oceanography.
©2007-2008 by Earthguide
at Scripps Institution of Oceanography
All rights reserved.