
Spectra of stars
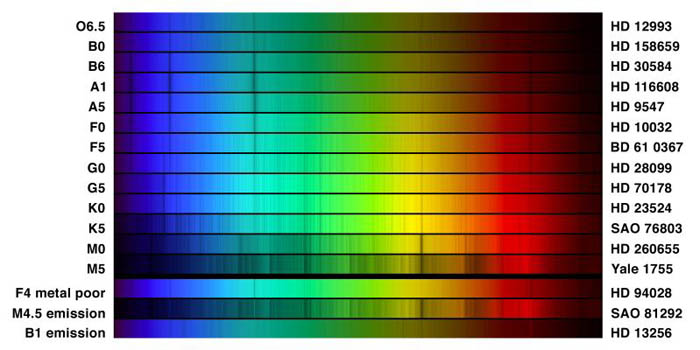
"This picture compares the spectra of different classifications of star, in the visual range from 400 to 700 nanometers (4000 to 7000 Angstroms). Thirteen regular types are shown, and at the bottom are three special cases, all selected from the spectrophotometric atlas by Jacoby, Hunter and Christian, 1984, which used data from the Kitt Peak National Observatory's 0.9-meter telescope." - National Optical Astronomy Observatory
 Larger image [1,075 KB]
In a nutshell
-
Hot dense objects like stars, planets, or moons produce a continuous spectrum, i.e., spectrum with no dark lines. How much light in each color range emitted by hot objects depends on its temperature. A hotter object produces a spectrum with more energy concentrated toward the blue side of the spectrum rather than the red. Thus, continuos spectra can be used to estimate the temperature of ojects such as stars.
- When the light in a continuous spectrum passes through
- This involves a very basic interaction between electromagnetic radition (energy in a form that has no mass) interacting with parts of atoms (matter). The area of physics that concentrates on these interactions is called quantum mechanics. Although it sounds very ..., the interaction of electromagnetic radiation and matter is ... global warming, what we know about the distant universe, and fluoresent light bulbs to name a few.
Questions for thought
- According to this diagram, most stars emit many of the colors in the rainbow, including our Sun. Does the Sun emit the same quantity of radiation at each color (frequency)?
- Are stars emitting and absorbing radiation outside of the frequencies shown on this diagram?
Related resources
-
High Resolution Solar Spectrum
Detailed view of our Sun's spectrum in the visual range.
National Optical Astronomy Observatory