Human emissions of carbon dioxide


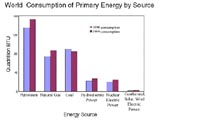
Statistics on the world use of petroleum, natural gas, coal, and other energy sources in 1990 and 1999. Note that in contrast to all other energy sources, the use of coal decreased between 1990 and 1999. Units are in Quadrillion Btu (British Thermal Units) - see the glossary for definition. From: International Energy Agency at International Energy Agency
The rise of carbon dioxide in the atmosphere is readily documented by direct measurements (i.e. the “Keeling” curve) and by the results of ice core studies (from the polar regions). However, the precise contribution to this rise from human-caused emissions of carbon dioxide is not so readily determined. Estimation of future carbon dioxide emissions from fossil fuels can be accomplished by analyzing the production and use of coal, petroleum and hydrocarbon gas as reported by multinational corporations and by various nations and then applying the appropriate statistics. Other smaller contributions to emissions like cement production by heating of carbonate, which also releases carbon dioxide, can also be estimated with some confidence.

Big uncertainties arise from estimating the contributions from burning of wood and dung as fuel and from destruction of grasslands and forests and deforestation in general. The reason is that most of such burning goes on at a small scale in a large number of poorly developed countries and is not reported with a high degree of accuracy. Deforestation, which is proceeding quite rapidly in many countries, can be monitored best by using spacecraft. However, the conversion of images from space of burning forests or changes in forest cover into units of “tons of carbon released” is not straightforward.


Major Carbon Emitting Countries in 1995, based on their percentage of the Global Total Emissions of Carbon. Notice how the USA, China, and Russia are in the top three. (From: Oak Ridge Laboratories, U.S. Dept. of Energy)
Another even more important asymmetry is the use of energy. The industrialized countries use considerably more energy per capita than the less developed countries and have correspondingly higher emissions. Energy use goes parallel with standard of living. Some of the more advanced countries (e.g. Sweden) achieve the same standard of living with less energy use, largely through higher efficiency of use. Not knowing the total emissions very well, and knowing the rates of change even more poorly, makes it difficult to extrapolate into the future. Again, these uncertainties mainly result from the lack of knowledge about burning of materials other than fossil fuel and about the destruction of forests — the use of coal and hydrocarbons is reasonably well known. Thus, the economic behavior and emissions of industrial countries can be quite well monitored, while this is not true for many of the less developed countries. This asymmetry in knowledge (and therefore potential control) complicates the process of reaching political agreements on emission controls.

This tabulation shows that people in the USA and Canada emitted roughly 5-6 times more carbon than the world average in 1997; the world average is 1 ton C per person. Note that by 2020 the world average will increase, but that the proportional difference between the USA and developing countries is expected to decrease. EE/FSU is Eastern Europe/Former Soviet Union. From: International Energy Agency at International Energy Agency