|
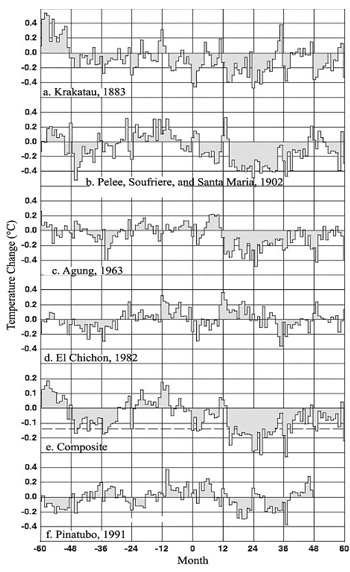
| Graphs of average temperatures 5 years before and 5 years after the listed various volcanic eruptions. Note that anomalously low temperatures always occur after an eruption (occurring at Month #0). Graph “e.” is a composite of the graphs a.–d. Graph “f.” is the response to the most recent Mt. Pinatubo eruption. (From: Climate Research Unit). |