|
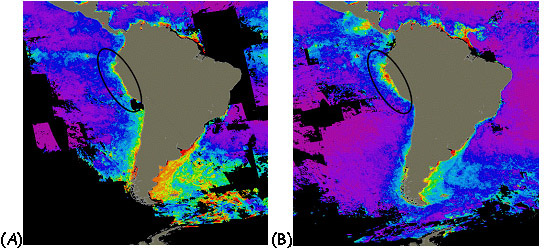
| A comparison of phytoplankton concentration during upwelling periods off the coast of Peru: (A) 1983, a severe El Niño and (B) 1985, a non-El Niño period. Note how much smaller the bloom (circled) is during El Niño conditions, when nutrient upwelling ceases. The color key needed to read the phytoplankton concentrations is the same as that in the above satellite image. (From: NASA) |