|
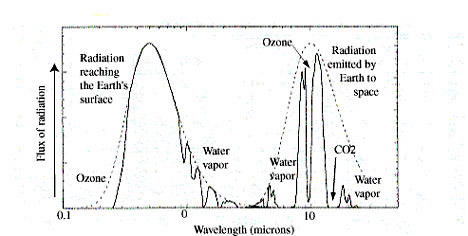
| Graph showing the mostly visible radiation spectrum emitted from the Sun as seen from the surface of the Earth (left curve) and the IR radiation emitted Earth as seen from space (right curve). Compared it to Figure 1 this graph shows the wavelengths that are absorbed by atmospheric gases, causing gaps in the spectrum. For the left curve, it is obvious how ozone acts to absorb UV light before it reaches the Earth’s surface with some visible light also being absorbed by water vapor. For the right curve, the impact that the major greenhouse gases have on the amount of IR that Earth emits to space is clear: carbon dioxide, ozone, and water vapor act together to absorb and re-emit radiation that stays trapped in the lower atmosphere (that is, the outgoing radiation from Earth is much less intense than expected from the temperature one would measure in space due to the effect of greenhouse gases). Carbon dioxide absorbs at wavelengths centered on 15 microns, ozone at wavelengths of 10 microns, and water vapor over broad ranges of wavelengths. |