GLOBAL WARMING: The Rise of CO2 & Warming


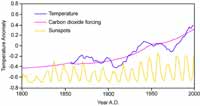
The time series shows the combined global land and marine surface temperature record from 1856 to 2001. Data from Jones et al., 1998; and from the Climate Research Unit at the University of East Anglia (www.cru.uea.ac.uk; compilation by Phil Jones).
The Earth has been warming since 1910, with a temperature maximum reached in the 1990’s. (The year 2001 is now the second warmest year on record, according to the World Meteorological Organization.)

The scientific conclusion reached is that warming is real.

But is this warming man-made? Carbon dioxide has been rising since the time of James Watt (1736 – 1819), inventor of the auto-controlled steam engine that helped jump-start the industrial revolution. Since then, coal, oil and natural gas have powered our economies. Hydro-power and nuclear power are comparatively minor contributors to energy needs (excepting certain countries such as Norway and France).

Today the amount of carbon dumped globally into the atmosphere corresponds, on average, to one ton per person on the planet, each year. In the United States, carbon-based energy is especially important. The average American per capita emission is 5 tons of carbon annually. In Sweden (with a similar standard of living as the US) the carbon output is less than two tons of carbon per person per year.

James Tyndall (Courtesy: NASA)
Carbon dioxide is a greenhouse gas – it traps heat radiation that is attempting to escape from Earth. The physics of this process was established by the Irish physicist John Tyndall (1820 – 1891) and the effect was calculated by Swedish chemist Svante Arrhenius (1859 – 1927).

The basic argument (that is, that greenhouse gases keep the Earth comfortably warm) has never been challenged, and it follows that an increase in carbon dioxide in the atmosphere undoubtedly produces a rise in temperature at ground level.

More information on the greenhouse effect.

Given this background, we next need to ask:

How much of the observed warming in this last century can be ascribed to the observed loading of the atmosphere with greenhouse gases by human activities?


Svante Arrhenius (Courtesy: www.nobel.se)
First, we turn to the reconstruction of the rise of carbon dioxide since the time of James Watt. The early part of the series is derived from extracting air in polar ice, and measuring its carbon dioxide content. The later part is based on the measurements of Charles D. Keeling, since 1957, on Mauna Loa.

The overall rise is from just below 280 ppm (the “pre-industrial” value) to the present values above 360 ppm, an increase of a factor of 1.3. The logarithm of 1.3 is 0.11, that of 2 is 0.30. Thus, we are a little more than one third of the way to a doubling of carbon dioxide, on a log scale. If doubling of carbon dioxide produces a temperature rise of between 1.5 and 5 degrees Celsius (as found in numerical experiments using climate models), we should see a warming of between 0.5 and 1.7 degrees Celsius. We do see the lower number of this range, but this does not prove that the rise upon doubling of carbon dioxide is in fact 1.5 degrees. The reason is that we are in a “transient”, that is, the change is too fast to allow equilibrium to establish itself.

Graph showing rise of CO2, from measurements in ice cores (Siple, Antarctica) and measurements from Mauna Loa, Hawaii (Keeling curve) since James Watt, inventor of the steam engine. (Pre-1990 data in: B. Moore & D. Schimel, 1992. Trace Gases and the Biosphere. UCAR, Boulder CO)
In fact, the answer is not known with a high degree of certainty, not only because of the lack-of-equlibrium problem (which involves uptake of heat by the ocean), but also because of additional complexities arising from air pollution, trace gases other than carbon dioxide, possible changes in the brightness of the Sun, and effects from volcanic activity.

Thus, in answer to the above question: Estimates vary from “little” to “much” to “most”, with the latter answer being the more credible one.

One way to obtain a quick estimate answer is by doing some simple calculations, based on the work of Svante Arrhenius, assuming a 2 degree Celsius rise in temperature per doubling of carbon dioxide (Arrhenius proposed a somewhat greater effect, neglecting compensating factors). The result is the graph below, showing that CO2 forcing can explain the temperature rise. That said, there may also be a role for the Sun in modifying the temperature rise driven by greenhouse gases. The minor drops in temperature right after 1900 and after 1960 coincide with reduced solar activity. To be sure, while this simple calculation may be enough to explain the observations, it is not a mathematical proof that the warming that has occurred since the days of James Watt is entirely due to human activity. It merely represents the simplest possible explanation.

Another way of stating the situation is this:

There is no compelling evidence that the observed overall warming in the 20th Century is anything but man-made.

The burden of proof is on those who would have us think that natural causes are solely or mainly responsible for this trend.

Graph showing that the observed temperature rise can easily result from the observed rise of CO2 , based on simple numerical experiment. (Smoothed temperature data in Jones et al., 1998; CO2 forcing data from CO2 history, and calculated expected rise in temperature assuming 2 degree Celsius rise for CO2 doubling; sunspot abundance from J.Lean, NASA)
Of course, showing that the observed warming entirely agrees with reasonable expectations for the rise in carbon dioxide does not exclude the possibility that some of this warming would have occurred anyway, without human help. But the warming of the past 30 years, from 1970 to the present, is unexplainable by any known natural cause. In any case, considerable further warming is very likely if emissions continue as in the past.

We know that CO2 causes warming. We do not know the likely rate within a factor of three. Ignorance is not a good basis for dealing with risk.