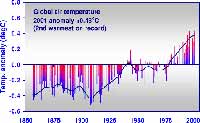
This is a time series graph showing the combined global land and marine surface temperature record from 1856 to 2001. The temperature is plotted as the difference (called an “anomaly ”) from the long-term average (a value calculated from the years 1961-1990). It is being compiled jointly by the
Climatic Research Unit and the UK Meteorology Office Hadley Centre and continually up-dated and improved. The purpose of these measurements is to detect climate change due to
global warming by measuring an increase in temperature in the records of thermometers. Increased concentrations of greenhouse gases in the atmosphere due to human activities are the underlying cause of global warming. (From: Jones, P.D., New, M., Parker, D.E., Martin, S. and Rigor, I.G., 1999: Surface air temperature and its changes over the past 150 years.
Reviews of Geophysics, 37, 173-199.)