
Extinct mammals of the ice ages: Mammoths and saber tooth tigers. (From: The Page Museum at the La Brea Tar Pits)
Extinct mammals of the ice ages: Mammoths and saber tooth tigers. (From: The Page Museum at the La Brea Tar Pits) |
 Map of North America showing the extent of the Laurentide Ice Sheet. The blue outline notes the ice sheet’s borders about 15,000 years ago. |
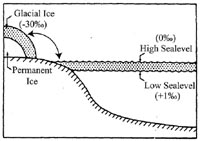 Cartoon of oxygen isotope changes during production of glaciers via seawater extraction. The ratio of 18O to 16O in a sample is expressed by scientists as the deviation (designated by the Greek letter “δ”) from the ratio of isotopes in a standard, where d18O = [sample ratio]/[standard ratio]-1). Note how during low sealevel (when glaciers are expanding) the ocean becomes enriched in 18O, leading to a positive isotopic value (+1‰), while the glacier becomes “depleted” in 18O, giving it a negative isotopic value (-30‰). (See the glossary for an expanded overview of the “δ” notation under “Oxygen Isotopes.”) |
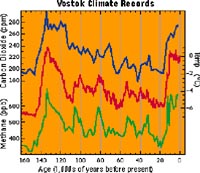 Ice core results from the Vostok drilling site in Antarctica. The top plot in blue is carbon dioxide, the middle plot in red is paleotemperature, and the bottom plot in green is methane. Note how the two greenhouse gases increase with temperature; also notice the recent warming about 20,000 years ago, with the brief dip in temperature during the Younger Dryas. |