
Slopes and Bathymetry
The shape of the sea floor
The shape of the sea floor
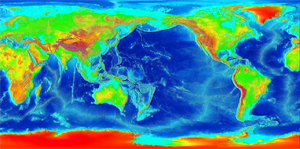
Map of the sea floor.
Click here to see a larger map and legend.
Where is it steep? Take a look at a map of the Earth's sea floor for yourself! This map shows the shape of the solid surface of the Earth. It shows elevation on land and bathymetry in the ocean.
This map was created from sea surface elevation data collected by satellite. The method is almost like magic because the depth of the sea floor is estimated from sea surface elevation using a method called satellite altimetry.
Map from the National Geophysical Data Center, NOAA
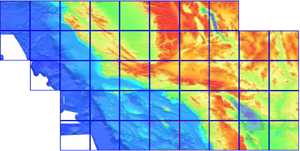
Bathymetry off southern California.
Maps from the source
Map from the National Geophysical Data Center, NOAA
What does this have to do with underwater slides that generate tsunami? Even under water, areas with steeper slopes tend to be more unstable and prone to slides.
Maps of sea floor bathymetry show where the gound is steepest and more likely to slide.
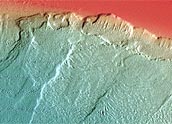
Side-scan images of underwater slides. The shapes of sea floor created by underwater slides Image courtesy Neal Driscoll
Whether tsunami will be generated is another matter...
Very detailed maps of the sea floor, like those created using side-scan sonar methods, may actually show the shapes of slides. Images like the one to the left shows collapsed ground and the scars left behind.
Ways to measure bathymetry
Information about these methods coming soon:
- Sonar - using sound waves to measure distance
- Multibeam - a kind of sonar
- Satellite altimetry - an entirely different approach
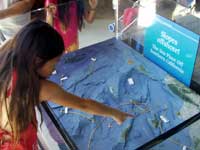
3-D model of the sea floor off southern California.
Image from the Ocean Institute.
All that you can do at OI
At the Ocean Institute
Students and visitors to the Ocean Institute can view our 3-D model of the sea floor off southern California.
Words:
In reference to the surface relief of the Earth, we use the term elevation in referring to the height of land, and the twin term bathymetry in referring to the depth of the sea floor. Elevation units are usually given in feet or meters above sea level. Units of bathymetry are usually given in fathoms or meters below sea level.
What's the meaning of the word slope?
Where to find more information:
NGDC Coastal Relief Model Vol. 06 Shaded Relief Images
Maps of the sea floor off southern California.
National Geophysical Data Center, NOAA
Surface of the Earth, 2 Minute Color Relief Images
Maps of the global sea floor.
National Geophysical Data Center, NOAA
Bathymetry of the Los Angeles Margin
Perspective image of U.S.G.S. map data.
Visible Earth, NASA
Multibeam Mapping of the Los Angeles, California Margin
Images that show the shape of the seafloor offshore Los Angeles and Orange Counties, California.
U.S. Geological Survey
Pacific Sea-Floor Mapping Images
Images of the seafloor from many locations on the Pacific Coast including Lake Tahoe and Crater Lake.
Western Regional Coastal & Marine GeologyU.S. Geological Survey
Produced in collaboration with Scripps Institution of Oceanography.
Website by Earthguide.
© 2003-2004 by the Ocean Institute
and the Regents of the University of California.
All rights reserved.
Last modifed Monday, December 10, 2004