 |
 |
Climate Change · Part One Climate Change 1 Syllabus 1.0 Introduction · 1.1 - Climate in the Spotlight · 1.2 - The Spec. of Sci. Opinion · 1.3 - Pundits, Adv., and Apocalypse · 1.4 - How to Tell Science from Rubbish 2.0 - The Earth's Natural Greenhouse Effect 3.0 - The Greenhouse Gases 4.0 - CO2 Emissions 5.0 - The Earth's Carbon Reservoirs 6.0 - Carbon Cycling: Some Examples 7.0 - Climate and Weather 8.0 - Global Wind Systems 9.0 - Clouds, Storms and Climates 10.0 - Global Ocean Circulation 11.0 - El Niño and the Southern Oscillation 12.0 - Outlook for the Future Climate Change · Part Two Introduction to Astronomy Life in the Universe Glossary: Climate Change Glossary: Astronomy Glossary: Life in Universe |
Climate in the Spotlight Introduction
There has been much discussion in the media and in the political realm about the evidence for climate change in connection with the greenhouse effect and the expected global warming that goes with it. In fact, no other environmental issue has garnered more attention in our nation’s capitol than climate change and the associated debate over global warming. This issue has been the topic of countless hearings over the past several years, most of which have been essentially economic in focus, although some have dealt directly with climate change science. The list of calamities that come with continued global warming is by now known to everyone: sea level rise, hot spells in summer, drought, floods, hurricanes, and perhaps even blizzards, among others. Each time there are unusually bad weather conditions the question arises whether perhaps global warming is to blame. Perhaps it is indeed at fault. Or perhaps there was an equal abundance of bad weather before global warming set in. Or perhaps the weather would have gotten worse without global warming. Or perhaps the weather is in fact no worse than it has been in the past, and we just notice things more now since we have more people, better instruments, and better communication. Another possibility is that perhaps global warming does not exist, and it is an illusion. Full media attention to the issue first arose in the summer of 1988, which brought the worst drought in decades to the US. For many this was proof that the man-made greenhouse effect had finally brought the expected global warming. In fact, during the 1980’s one temperature record after another was broken. And then the same happened again in the 1990’s. Has global warming arrived? Carbon Dioxide (CO2) Increase
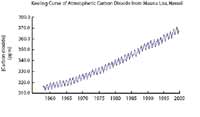
Although it is only a trace gas having concentrations much less than 1% in our atmosphere, carbon dioxide’s tremendous increase from the combustion of fossil fuels since the mid-1800’s has had scientists worried about its potential to exacerbate what is called the greenhouse effect. The greenhouse effect is a phenomenon whereby atmospheric gases with special physical properties (like carbon dioxide, methane and even water vapor) help trap heat received from the sun, making our planet warmer than it would be otherwise. To its credit, the greenhouse effect has been around long before humans began to burn fossil fuels, and it is a “natural” phenomenon in that makes life habitable for all living things. The problem lies in the possibility that human activities over the past 150 years may result in an increase of this greenhouse effect that could, in turn, cause large-scale changes in the climate system. It is this potential for human-induced change in the greenhouse effect that we refer to as global warming. Since carbon dioxide has the highest concentration of all the greenhouse gases and is the most likely to cause us problems in the very near future, it is the greenhouse gas that has received the most attention in the debate over global warming. However, as we shall learn in later chapters, increased emission of other gases, especially methane, also pose a strong threat to the stability of Earth’s climate.
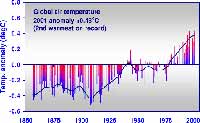
Global Temperature Increase
While this increase in carbon dioxide has occurred, temperatures in the northern hemisphere have risen by between 1°F and 2°F (almost 1°C) since A.D. 1850, as recorded by measurements. The record only goes back 150 years because direct measurements before 1850 are hard to find. The ten warmest years on record have occurred since 1983, seven of them since 1990. Global temperature in 1998 was the hottest in the historical record. This amount of overall increase in temperature is approximately equal to the amount of increase that is predicted by raising the abundance of carbon dioxide by one third of pre-industrial values – exactly what has happened in the last 150 years.
|
back to top |
| © 2002 All Rights Reserved - University of California, San Diego |